
Overview
What I built
- Data pipelines to centralize costs and revenue into a single source of truth.
- Visualizations and KPIs for project-level profitability and forecasting.
- Exportable reports for executive review.
Impact
Technologies used
- Next.js, React
- PostgreSQL
- Node.js
Outcome
Problem
Solution
Architecture
Text
Ingest (ETL) -> Central Postgres (normalized schemas) -> API (Next.js) -> Frontend (Reports & Visualizations)
Key components
- ETL jobs to import billing and time-sheet data
- Normalized data model for costs, revenues, and allocations
- Forecasting module that projects revenue and costs based on historical trends
- Role-based UI with exportable investor-style reports
Features
- Interactive waterfall charts and unit-economics breakdowns
- Scenario mode for 'what-if' projections
- Scheduled exports and executive summary emails
Screenshots / Media
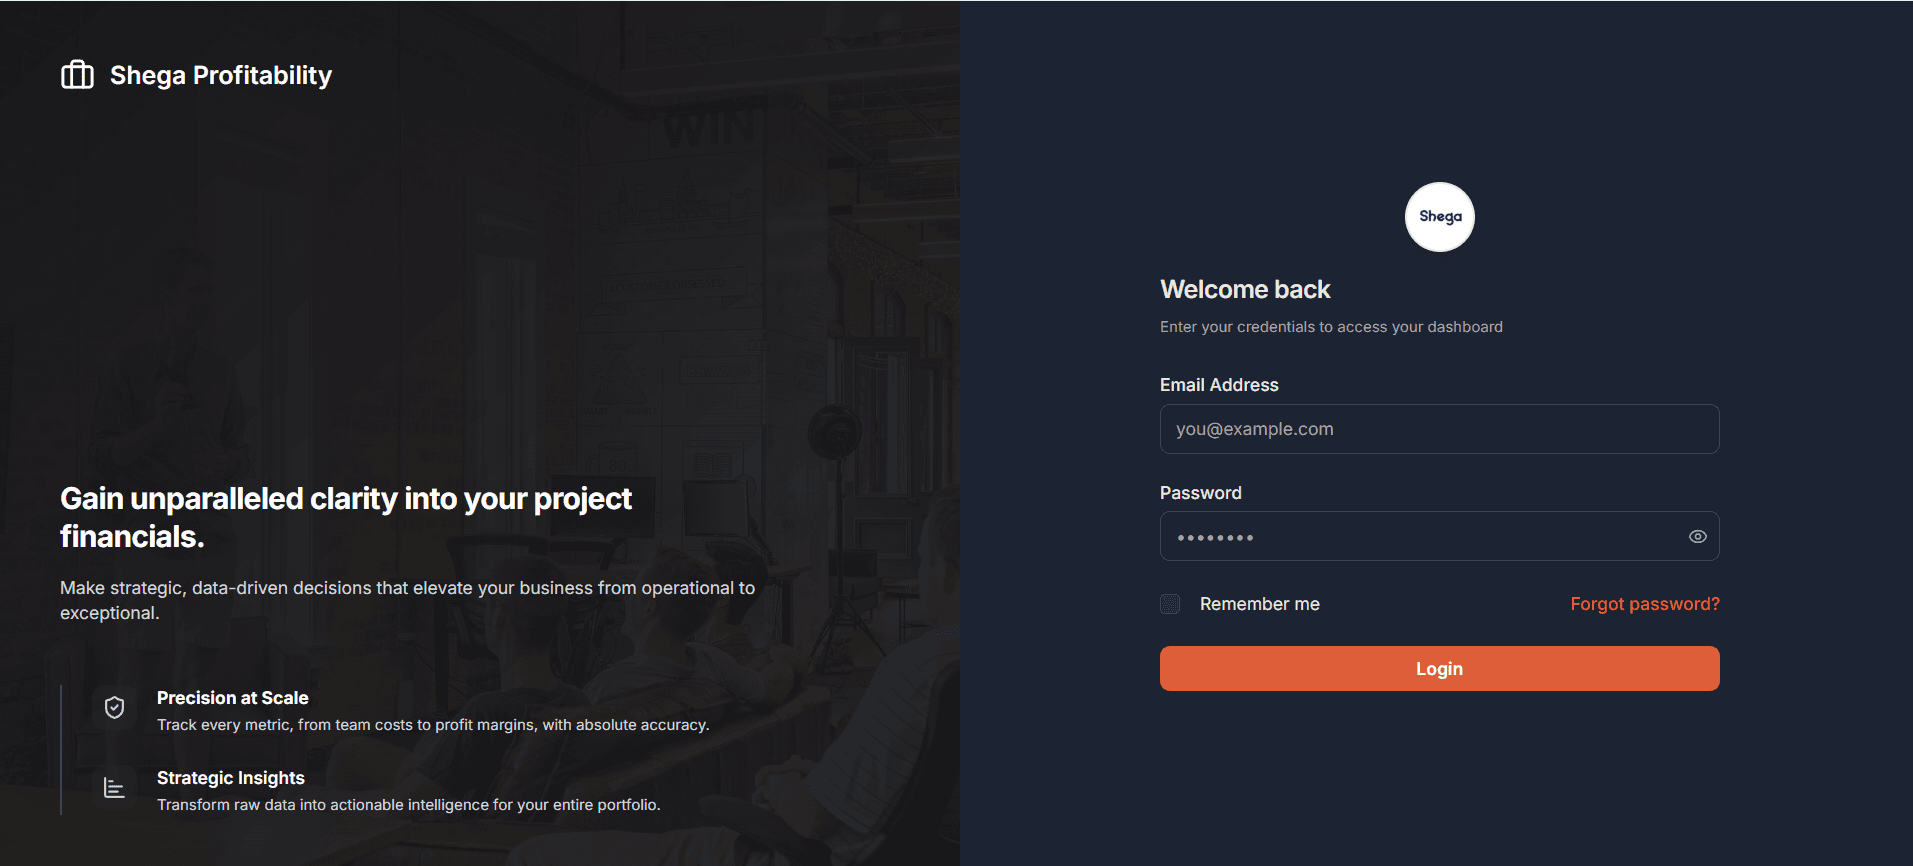
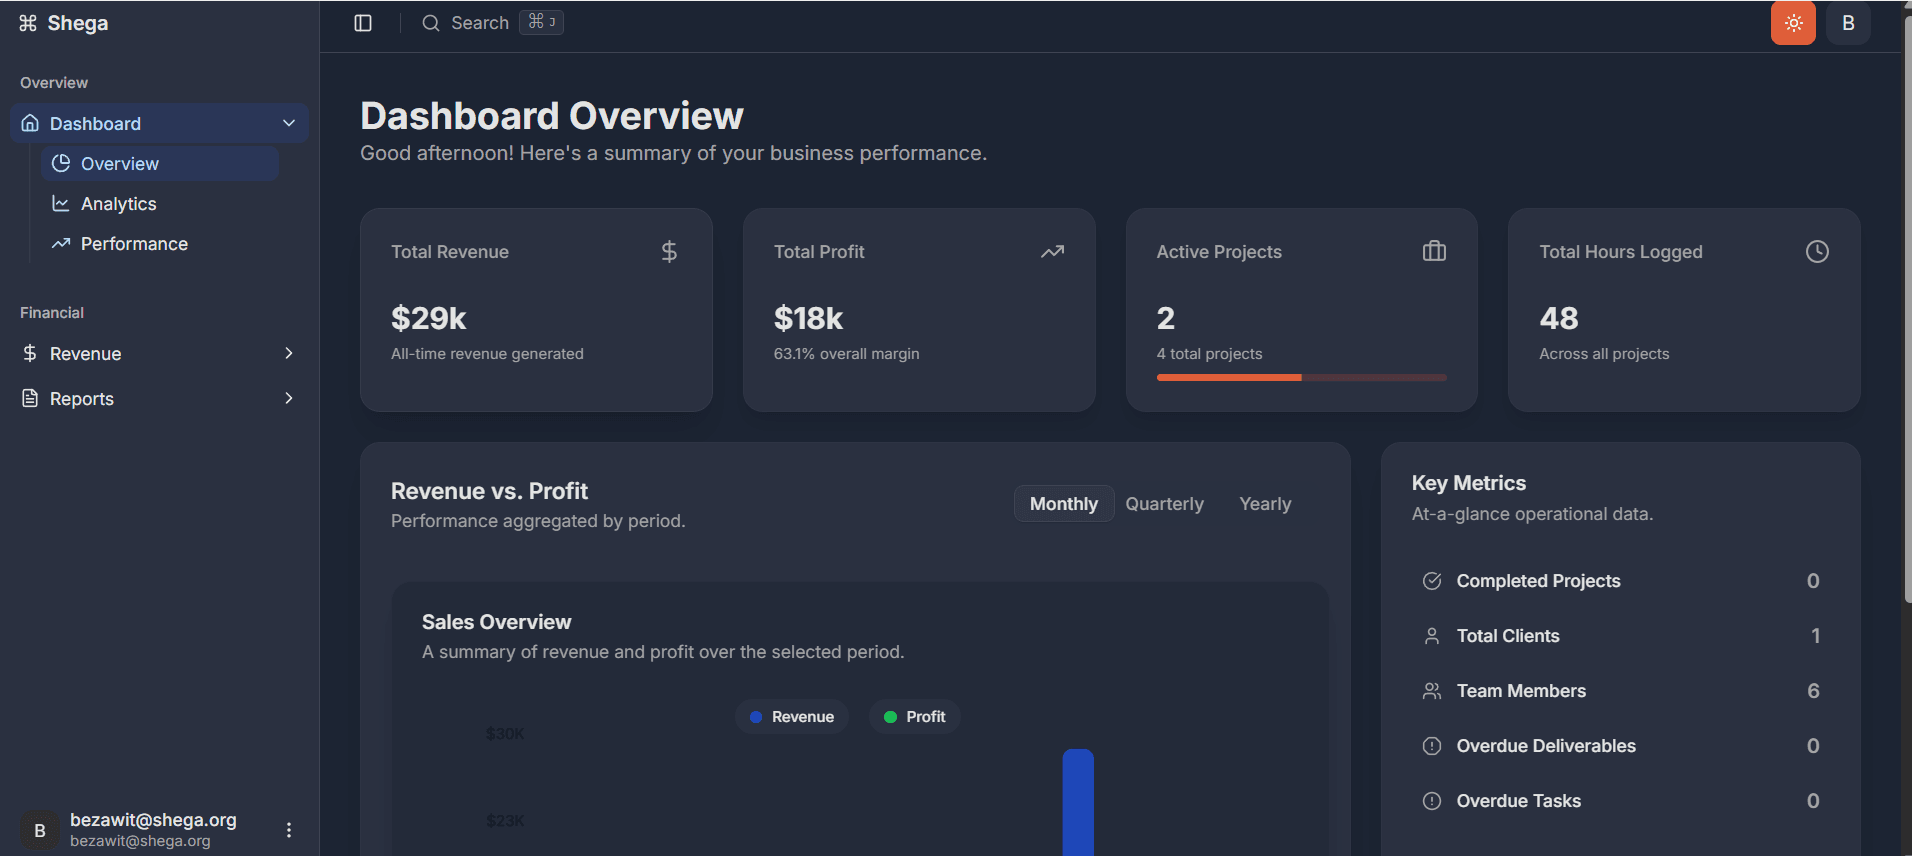
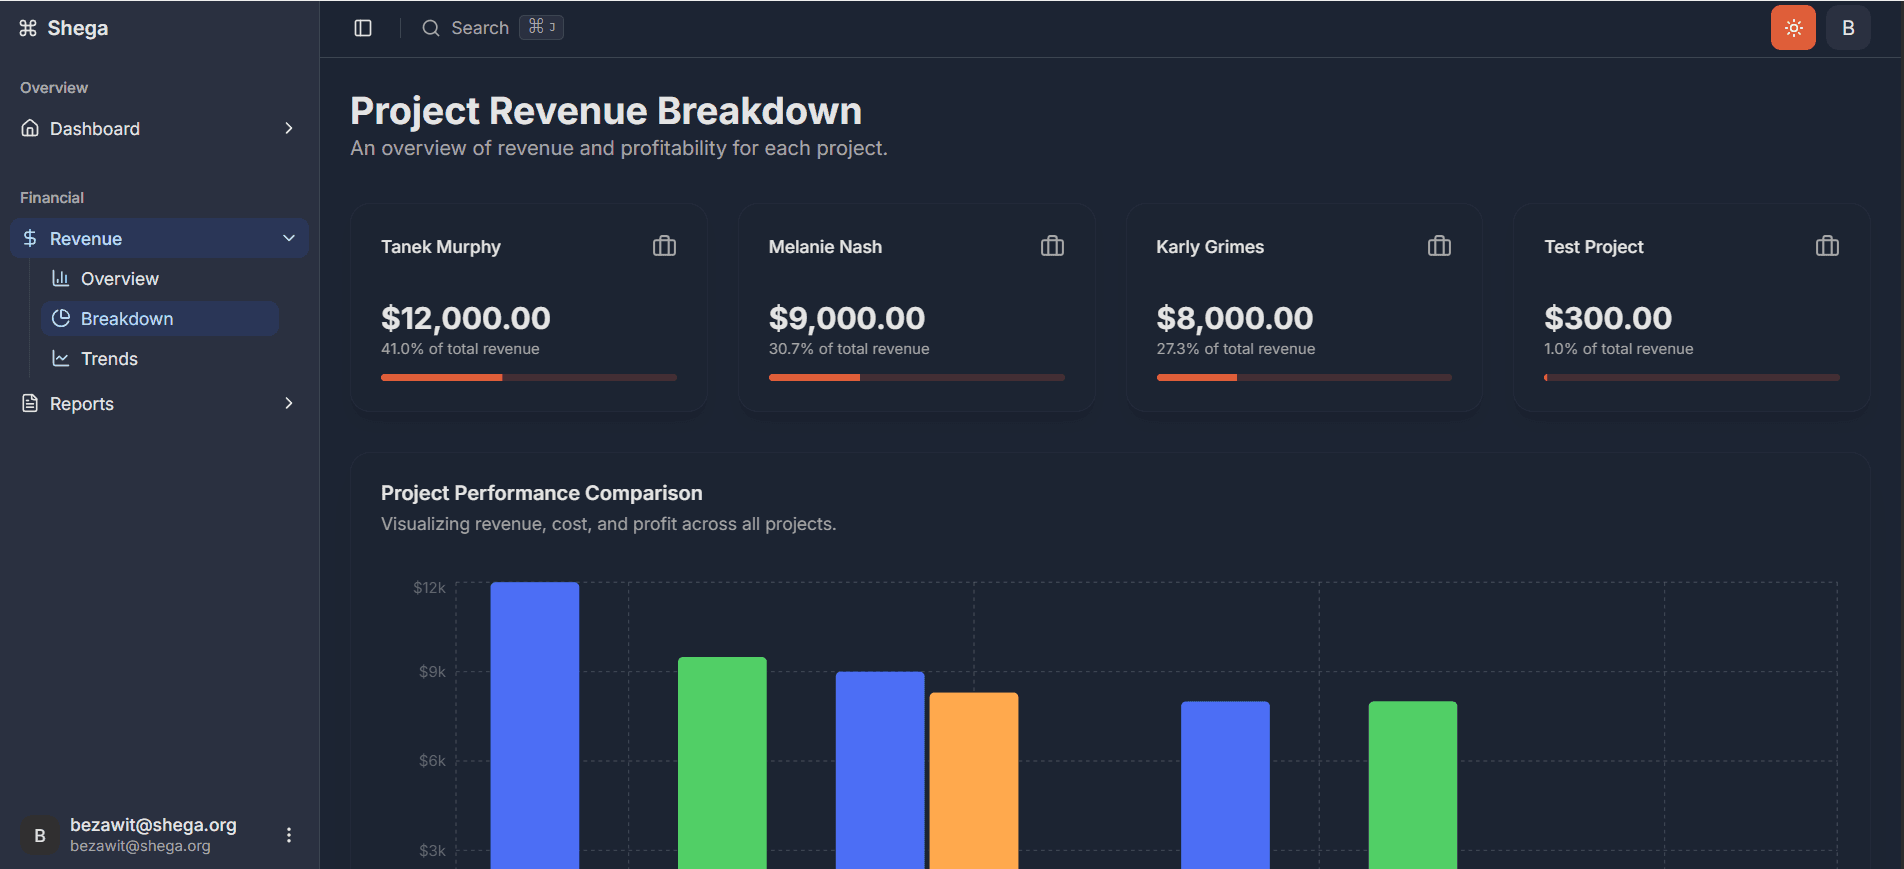
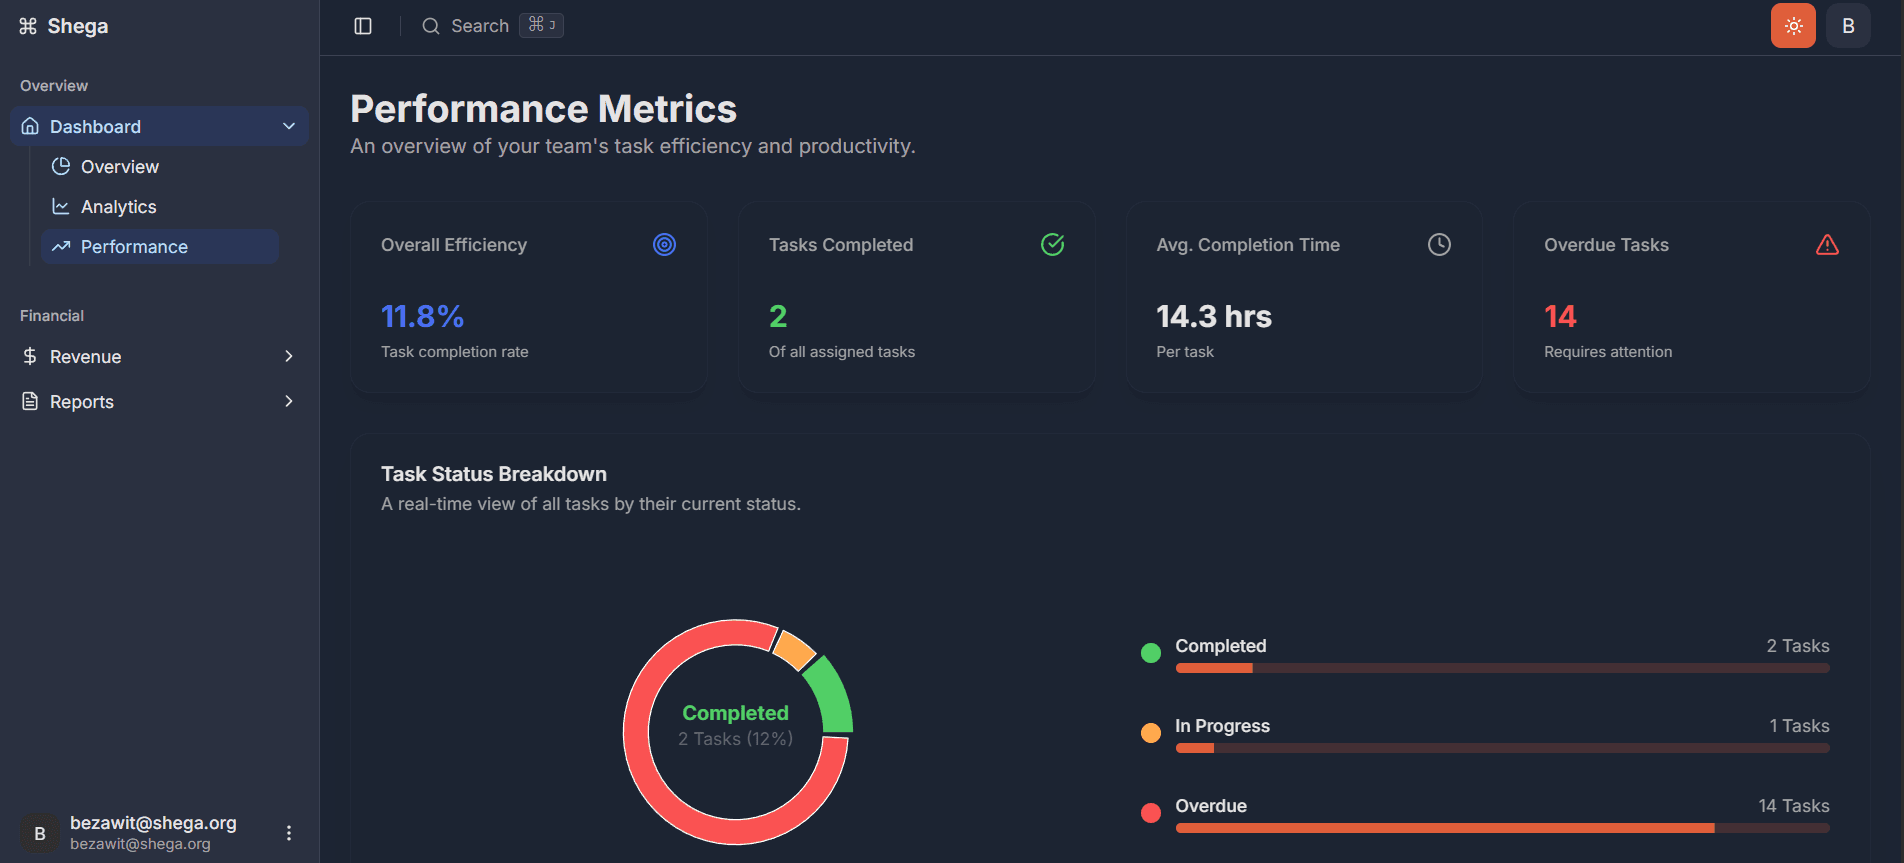
Metrics
- Improved forecast accuracy by over 15%
- Reduced manual reconciliation time by ~60%
Lessons learned
- Establish canonical data boundaries early — it saved time when integrating external billing sources.
- Presenting clear KPIs to stakeholders changed behavior quicker than complex models.
Next steps
- Add more 'what-if' scenarios and integrate with accounting systems for automated month-end reconciliation.